
For “Chord Progression in Major Key Songs” and “Chord Progression in minor Key Songs” menu in “Jazz Standards Statistics“, I’d like just to share some explanation or tips of the dashboard for the sake of your better experience.
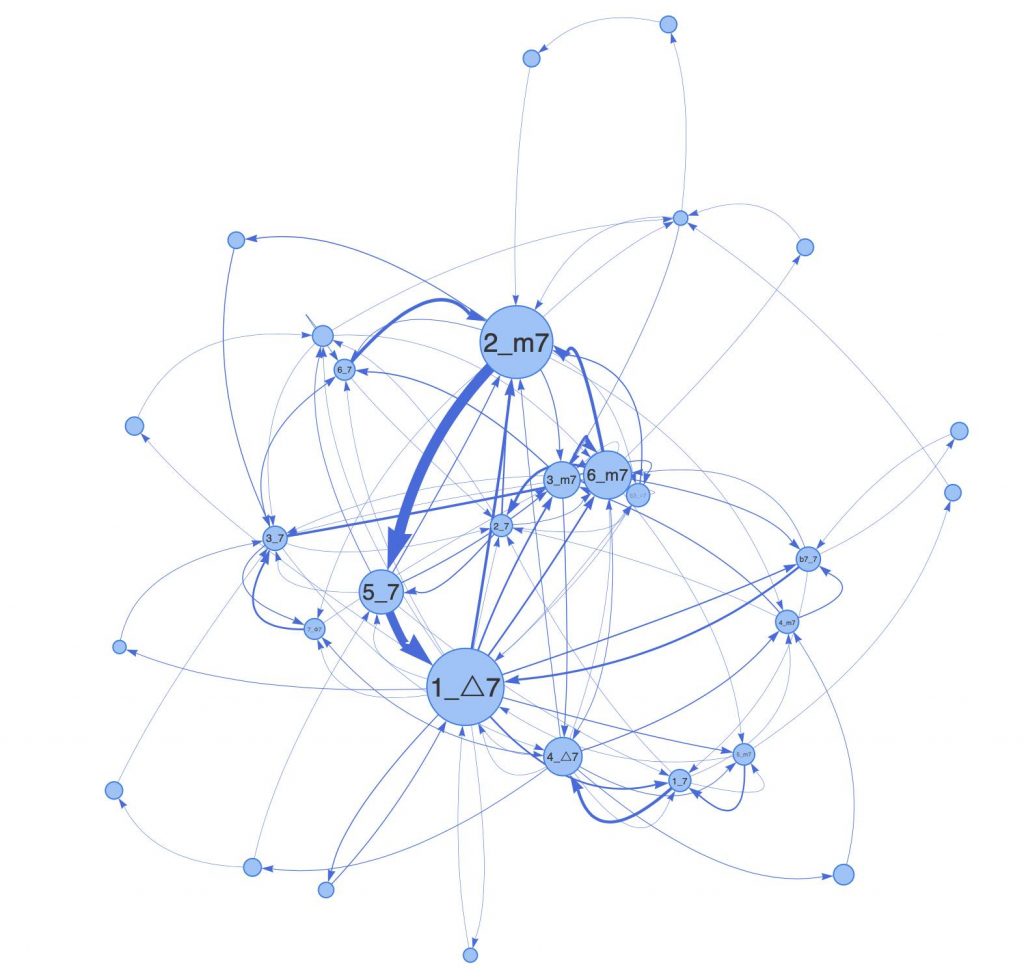
This is how chord progression statistics look like when visualized in network diagram. Each “node” represents chord (eg, 1_△7) and “arrow” represents chord motion. For example, dominant motion 5_7 -> 1_△7 corresponds with an arrow from node 5_7 to node 1_△7.
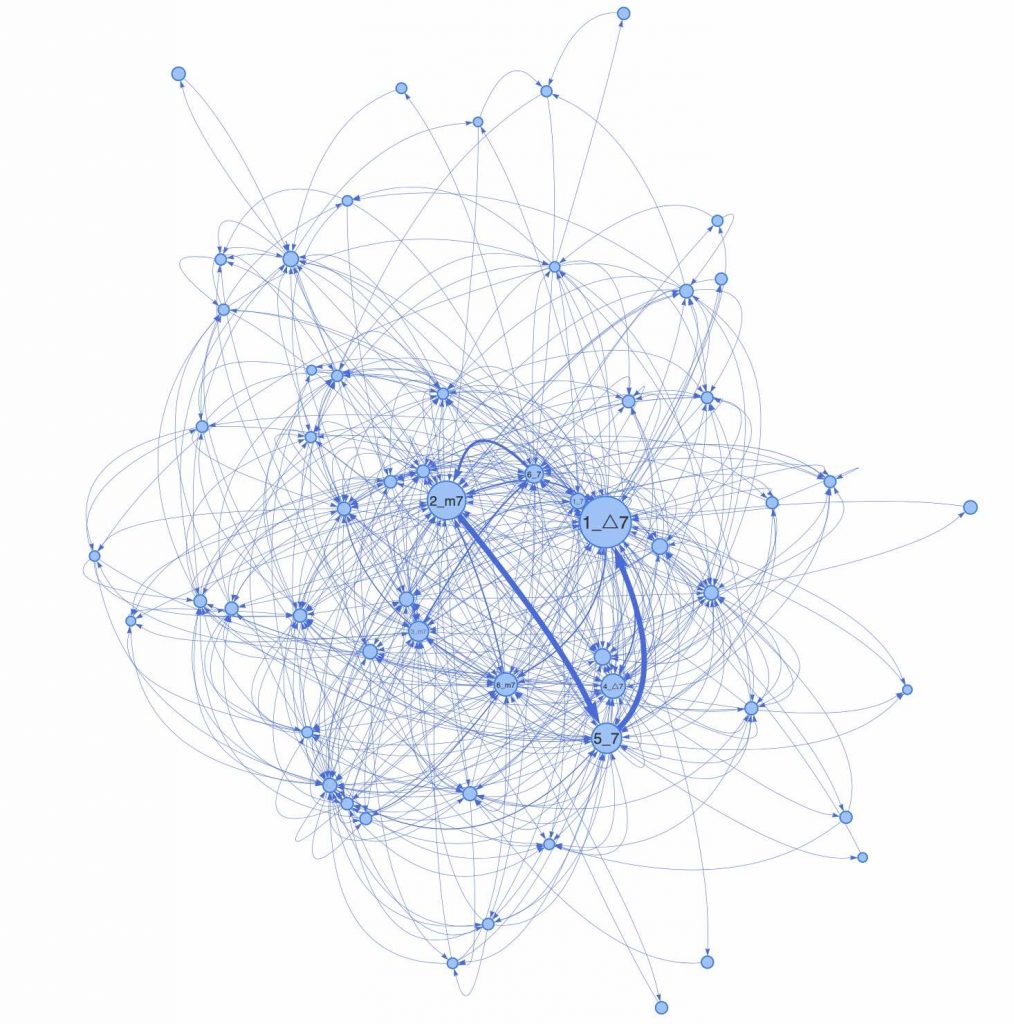
Generating this network diagram takes much computation resource of your PC, the dashboard has the default Data Size setting with smaller number like 10 songs. Above diagram is when Data Size = 1350. Below is a diagram with Data Size = 10.
To avoid overloading your web browser, besides Data Size selection, the dashboard has a function to reduce the number of nodes by identifying some chords to others. For example, you can choose if you want to identify _6 (major 6th) chords and _△7 chords. As a default setting, all this kind of options are enabled. If your PC is capable to handle more nodes, you can disable these options and increase Data Size.
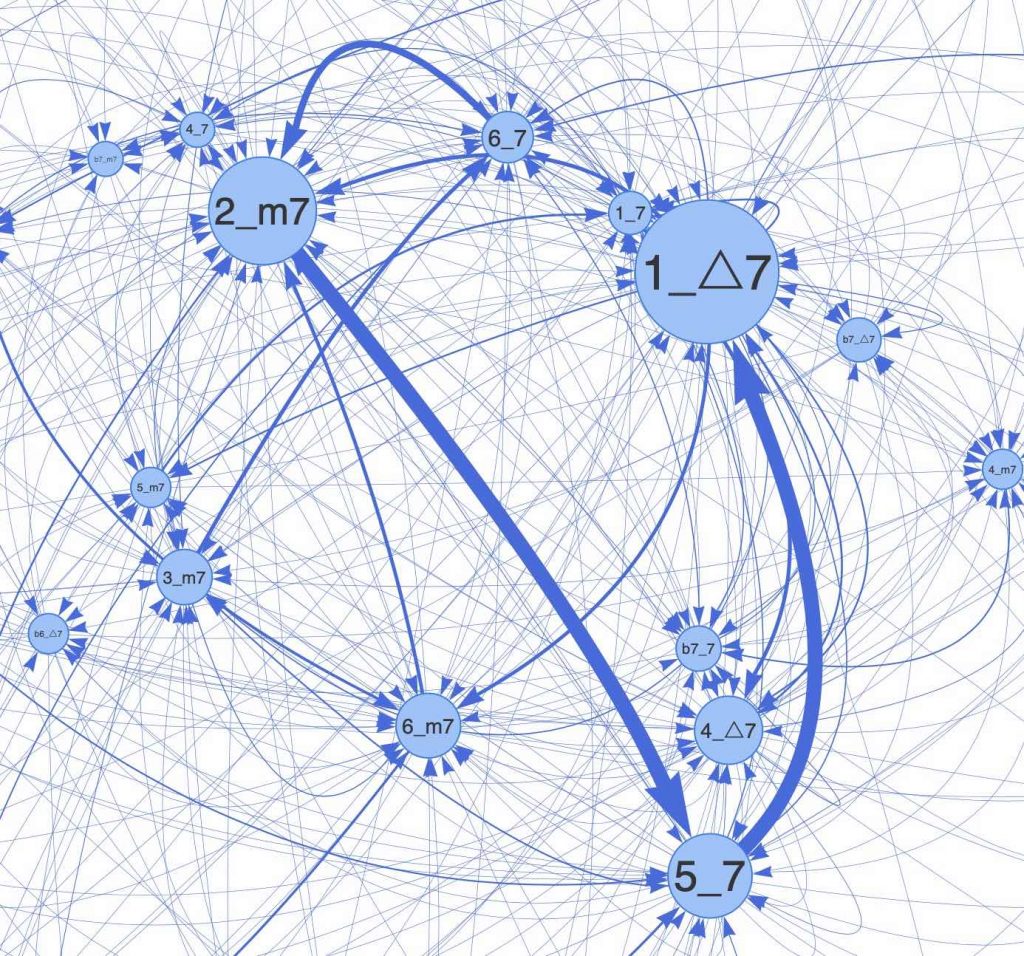
Okay, let’s get back to the diagram. When you zoom, you can see frequent chord progressions like 3_m7 –> 6_7 –> 2_m7 –> 5_7 –> 1_△7 in Major key songs. Have fun exploring something unexpected 🙂
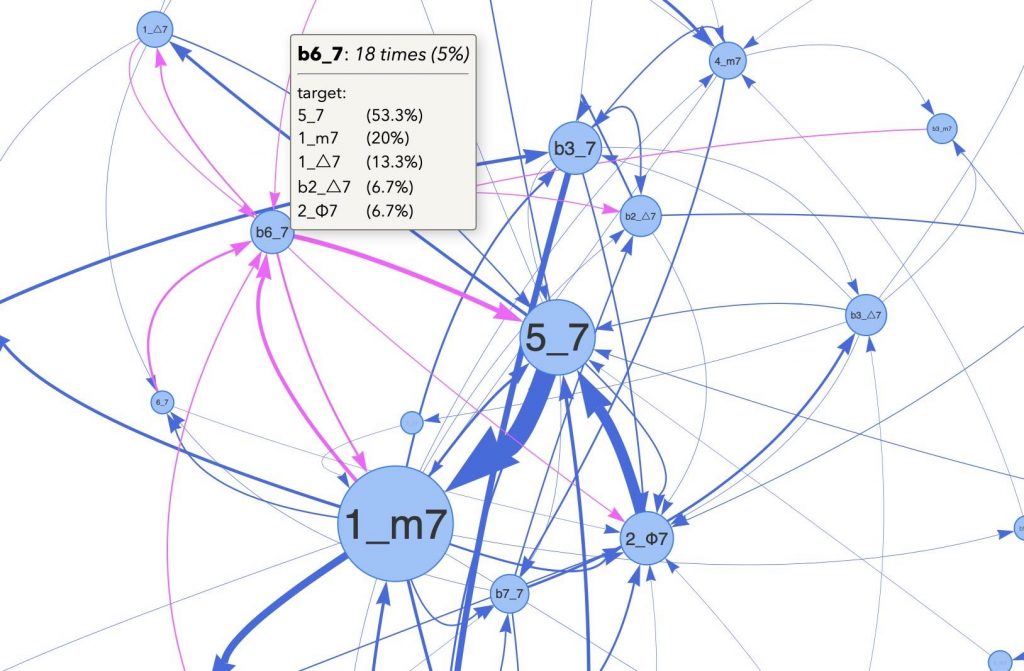
By the way, on mouse-on, each node displays node occurrence frequency and target chord tendency. In above screenshot (Data Size = 50 –> 7 minor key songs, 360 chords in total), b6_7 node showing that b6_7 appears 18 times (5%) and b6_7 most oftenly moves to 5_7 (53.3%), followed by 1_m7 (20%), 1_△7 (13.3%), etc.
Finally let me share how the size of nodes and the thickness of arrows are determined for your reference.
The size of each node is determined by chord occurrence frequency. i.e. The more the chord appears, the bigger the node is. More in concrete, for example, let’s assume that you set Data Size = 100. Among 100 songs, there are 85 Major key songs, and 4354 chords occurs in total. Out of 4354 chords, 1_△7 chord appears 653 times, which is 15%. Meanwhile, 4_△7 has 5.3%. In this case, 1_△7 node is roughly 3 times bigger than 4_△7 node.
The thickness of each arrow is determined by, basically(*), the ratio of that chord motion out of all motions from the node. For example, let’s look at an arrow from 5_7 to 1_△7. The 5_7 chord goes to 1_△7 (63.7%), followed by 3_m7 (6.9%), 1_7 (4.7%), etc. So the arrow from 5_7 to 1_△7 is 9 times thicker than that from 5_7 to 3_m7.
But as I wrote basically(*) above, the thickness is not determined solely by this calculation (“target-chord-factor”). It also depends on the size of the node (“size-factor”). By determining the thickness with product of “size-factor” and “target-chord-factor”, we can have thicker line for “frequent motion”.
One Reply to “Chord Progression”